Performance tips
Recommendation
We recommend using a Reverse Proxy with Caching when deploying OBA in production.
In this page, we describe two performance tests of OBA:
- The overhead introduced by framing SPARQL results into JSON; and
- The performance of the API when retrieving results when multiple requests are received at the same time.
The tests have been performed on the model catalog OBA-Generated API, which uses a Fuseki triple store as SPARQL endpoint. The tests have been performed in 2 machines (1 with the API, another one with the SPARQL endpoint) with the same conditions: 8 GB of RAM and 2 CPUs.
Overhead analysis
In order to perform this test, we retrieved a series of results from a SPARQL endpoint (Fuseki server) doing SPARQL queries and we compared them against doing an equivalent query through an OBA-generated API (GET queries, without cache enabled). The queries attempt to retrieve the individuals of various classes (e.g., GET all datasets, get all persons) and not single individuals. The corresponding queries in SPARQL use CONSTRUCTs.
The results show that OBA adds a slight overhead below 150ms for the majority of the queries with respect to the SPARQL endpoint (below 50ms); and between 150 and 200ms for 8% of the queries.
cat endpoint.json  | ./../vegeta report -type="hist[0,50ms,100ms,150ms,200ms,250ms, 350ms]"
Bucket           #   %       Histogram
[0s,     50ms]   59  98.33%  #########################################################################
[50ms,   100ms]  1   1.67%   #
[100ms,  150ms]  0   0.00%
[150ms,  200ms]  0   0.00%
[200ms,  250ms]  0   0.00%
[250ms,  350ms]  0   0.00%
[350ms,  +Inf]   0   0.00%
cat api_cached_disabled_60s_1_1.json  | ./../vegeta report -type="hist[0,50ms,100ms,150ms,200ms,250ms, 350ms]"
Bucket           #   %       Histogram
[0s,     50ms]   0   0.00%
[50ms,   100ms]  0   0.00%
[100ms,  150ms]  0   0.00%
[150ms,  200ms]  55  91.67%  ####################################################################
[200ms,  250ms]  5   8.33%   ######
[250ms,  350ms]  0   0.00%
[350ms,  +Inf]   0   0.00%
Since we use pagination, we expect these results to be applicable for other APIs and knowledge graphs. The only case where the overhead may increase is when a resource has hundreds of properties, as the framing into JSON-LD will be delayed. This may be circumvented with a custom query; or by simplifying the API schema of the target class. So far, we have not experienced any delay of this kind.
Result retrieval performance
We evaluate three ways to obtain 100 resources from a SPARQL endpoint (we used Fuseki server in this analysis).
Methods:
- Using an API generated by OBA (python) with pagination.
- Using an API generated by OBA (python) with pagination and Reverse Proxy with caching enabled (NGINX).
- Sending the SPARQL query directly to endpoint.
Summary
When using a Reverse Proxy with Caching, OBA performs appropriately for deployment in a production environment. We recommend to use NGINX and follow the NGINX Content Caching guide.
The following figures show the latency by percentile distribution in a test scenario, where a client sent 60 requests per second over 600 seconds. Tests have been performed on a Fuseki server and the current Python implementation for OBA.
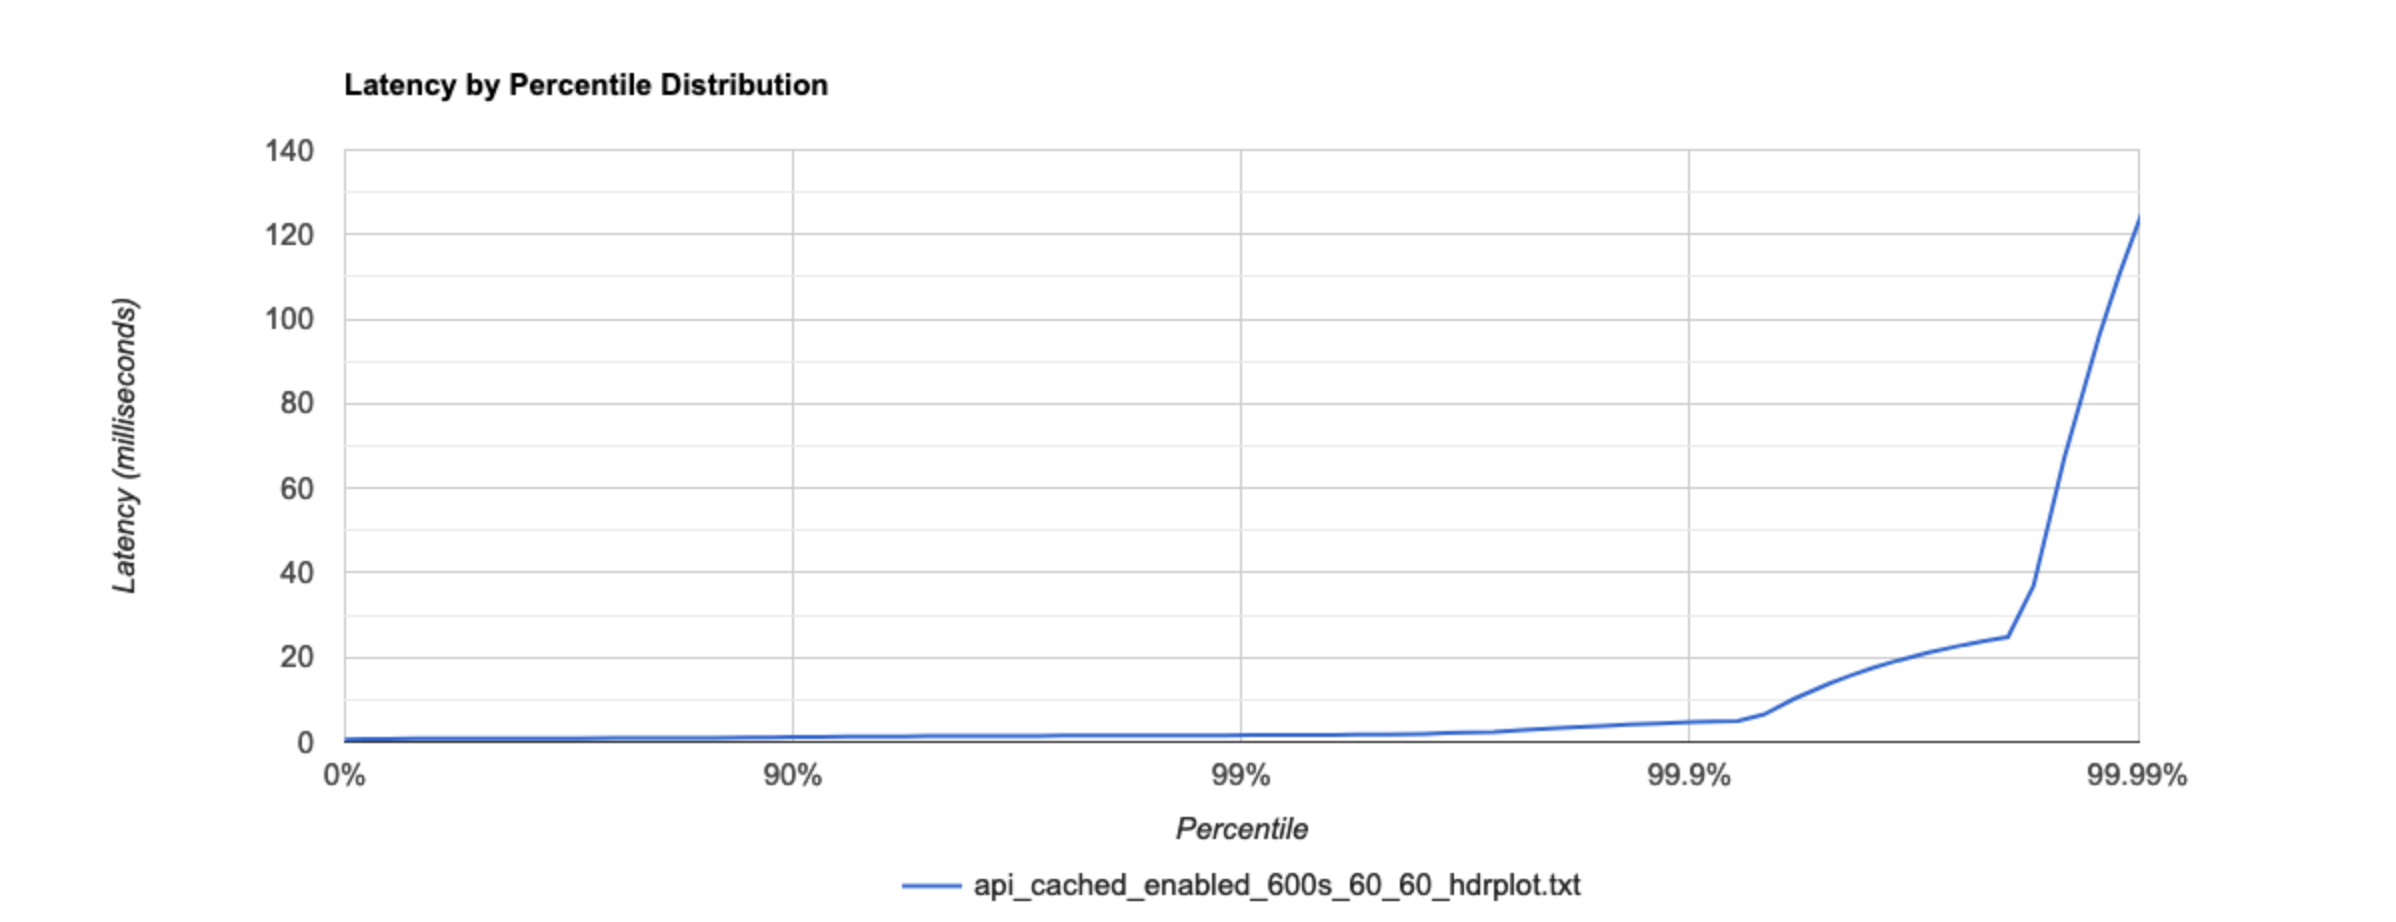 Figure 1: Submitting 60 requests per second using Reverse Proxy with Caching
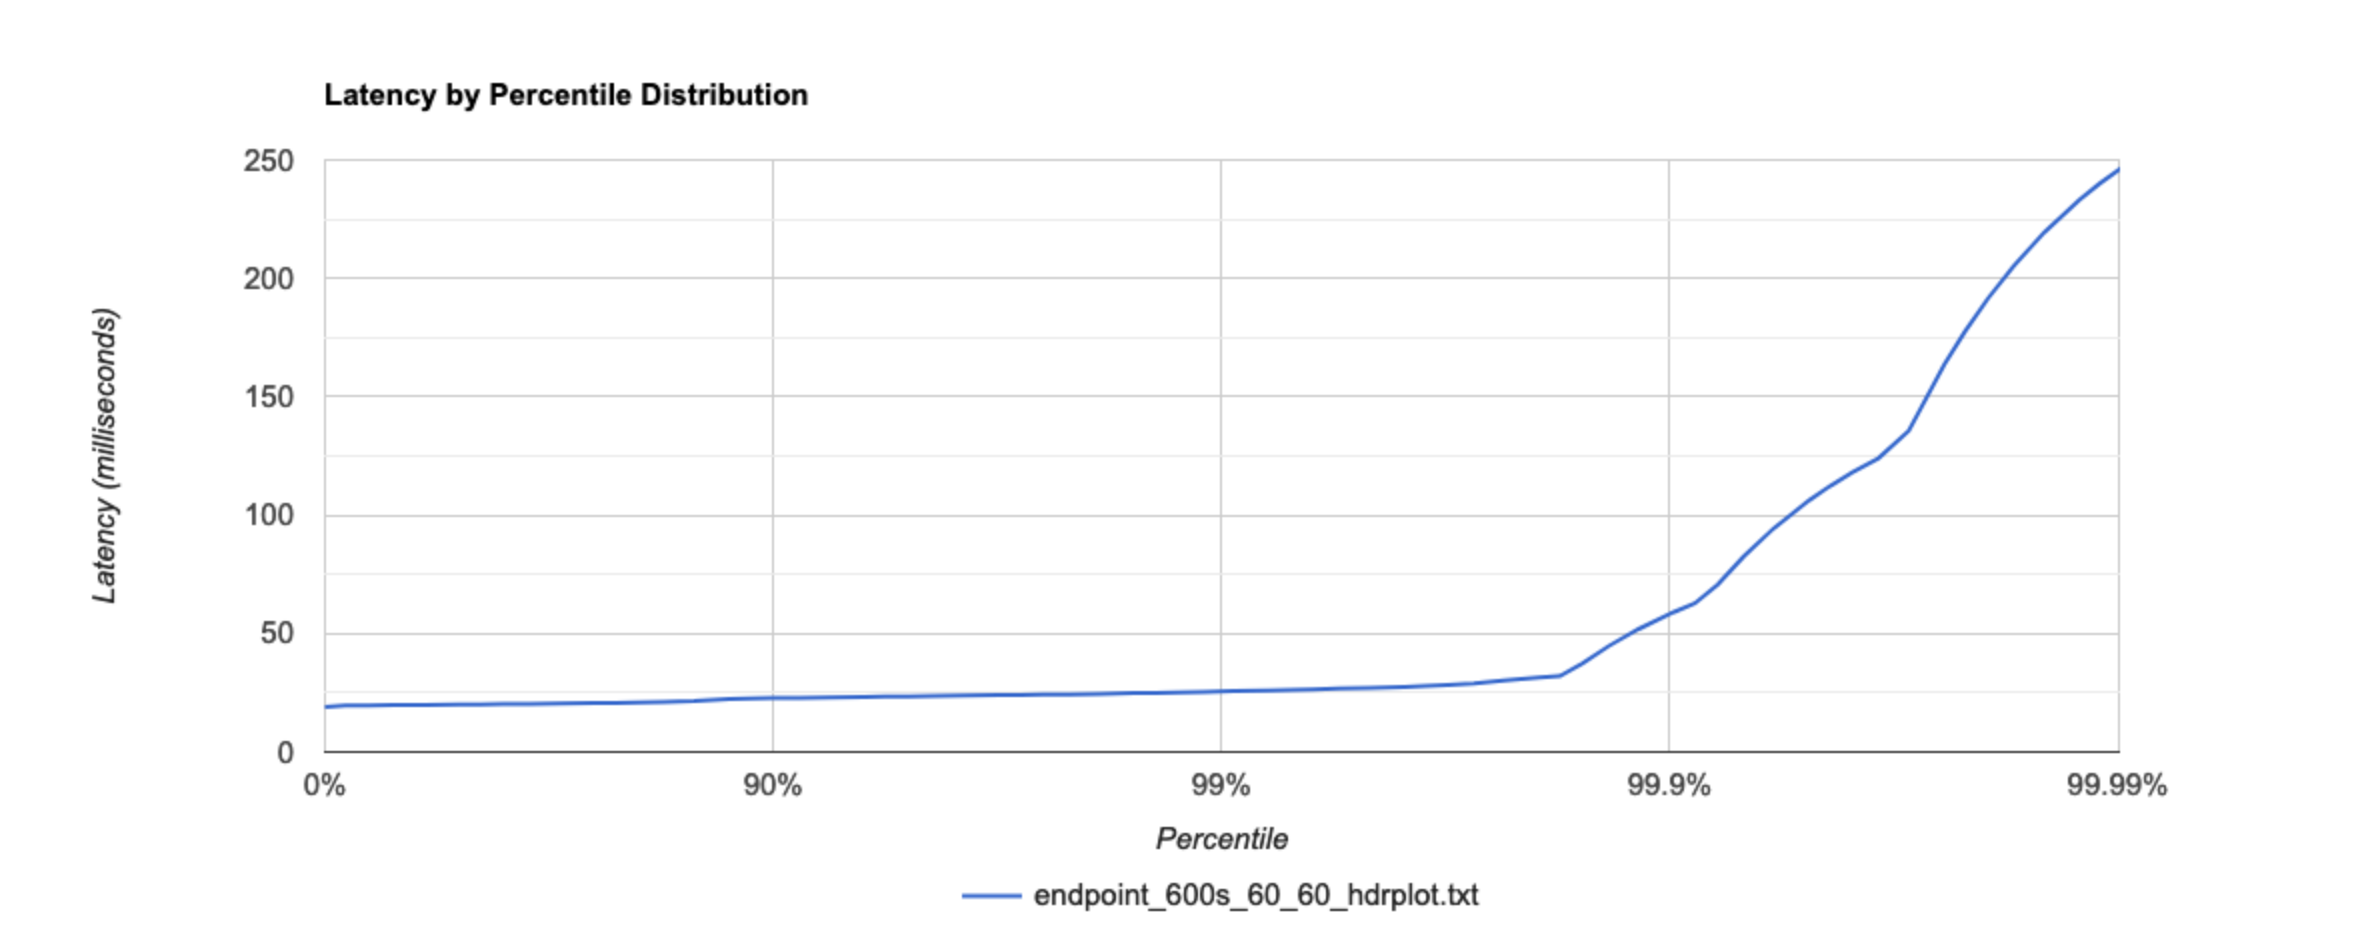 Figure 2: Submitting 60 requests per second to the SPARQL endpoint
As shown in both figures, latencies are similar in the 99.9% of the requests when enabling a reverse proxy with caching. When disabling the reverse proxy with caching, the performance deteriorates when receiving more than 10 queries per second, as shown in the tables below. Therefore, we recommend enabling a reverse proxy with caching when deploying OBA.
Tests
Rate (number of request per second): 5, 10, 60
Rate 5 rq/sec
Reverse Proxy with caching disabled
Requests      [total, rate, throughput]         300, 5.02, 5.00
Duration      [total, attack, wait]             59.968s, 59.8s, 168.373ms
Latencies     [min, mean, 50, 90, 95, 99, max]  162.708ms, 172.199ms, 167.086ms, 200.934ms, 203.843ms, 207.774ms, 238.92ms
Bytes In      [total, mean]                     20211300, 67371.00
Bytes Out     [total, mean]                     0, 0.00
Success       [ratio]                           100.00%
Status Codes  [code:count]                      200:300
Error Set:
Bucket           #    %
[0s,     100ms]  0    0.00%
[100ms,  200ms]  266  88.67%
[200ms,  300ms]  34   11.33%
Reverse Proxy with caching enabled
Requests      [total, rate, throughput]         300, 5.02, 5.02
Duration      [total, attack, wait]             59.801s, 59.8s, 904.482µs
Latencies     [min, mean, 50, 90, 95, 99, max]  780.385µs, 1.079ms, 933.508µs, 1.179ms, 1.339ms, 1.591ms, 33.065ms
Bytes In      [total, mean]                     20211300, 67371.00
Bytes Out     [total, mean]                     0, 0.00
Success       [ratio]                           100.00%
Status Codes  [code:count]                      200:300
Error Set:
Bucket           #    %
[0s,     100ms]  300  100.00%
[100ms,  200ms]  0    0.00%
SPARQL Endpoint (Fuseki)
Requests      [total, rate, throughput]         300, 5.02, 5.01
Duration      [total, attack, wait]             59.821s, 59.8s, 21.403ms
Latencies     [min, mean, 50, 90, 95, 99, max]  19.749ms, 22.187ms, 21.43ms, 24.774ms, 25.406ms, 29.059ms, 49.67ms
Bytes In      [total, mean]                     44750700, 149169.00
Bytes Out     [total, mean]                     166500, 555.00
Success       [ratio]                           100.00%
Status Codes  [code:count]                      200:300
Error Set:
Bucket           #    %
[0s,     100ms]  300  100.00%
[100ms,  200ms]  0    0.00%
Rate 10 rq/sec
Reverse Proxy with caching disabled
Requests      [total, rate, throughput]         360, 6.00, 5.84
Duration      [total, attack, wait]             1m2s, 59.983s, 1.693s
Latencies     [min, mean, 50, 90, 95, 99, max]  172.402ms, 1.665s, 1.706s, 1.739s, 1.746s, 2.26s, 2.454s
Bytes In      [total, mean]                     24253560, 67371.00
Bytes Out     [total, mean]                     0, 0.00
Success       [ratio]                           100.00%
Status Codes  [code:count]                      200:360
Error Set:
Bucket           #    %
[0s,     100ms]  0    0.00%
[100ms,  200ms]  1    0.28%
[200ms,  300ms]  4    1.11%
[300ms,  400ms]  1    0.28%
[400ms,  500ms]  0    0.00%
[500ms,  600ms]  1    0.28%
[600ms,  700ms]  2    0.56%
[700ms,  800ms]  2    0.56%
[800ms,  900ms]  7    1.94%
[900ms,  1s]     0    0.00%
[1s,     5s]     342  95.00%
Reverse Proxy with caching enabled
Requests      [total, rate, throughput]         600, 10.02, 10.02
Duration      [total, attack, wait]             59.901s, 59.9s, 961.661µs
Latencies     [min, mean, 50, 90, 95, 99, max]  747.596µs, 1.352ms, 932.156µs, 1.216ms, 1.415ms, 1.592ms, 229.925ms
Bytes In      [total, mean]                     40422600, 67371.00
Bytes Out     [total, mean]                     0, 0.00
Success       [ratio]                           100.00%
Status Codes  [code:count]                      200:600
Error Set:
Bucket           #    %
[0s,     100ms]  599  99.83%
[100ms,  200ms]  0    0.00%
[200ms,  300ms]  1    0.17%
SPARQL Endpoint(Fuseki)
Requests      [total, rate, throughput]         600, 10.02, 10.01
Duration      [total, attack, wait]             59.924s, 59.9s, 23.678ms
Latencies     [min, mean, 50, 90, 95, 99, max]  19.588ms, 21.506ms, 20.95ms, 24.018ms, 24.498ms, 27.789ms, 52.641ms
Bytes In      [total, mean]                     89501400, 149169.00
Bytes Out     [total, mean]                     333000, 555.00
Success       [ratio]                           100.00%
Status Codes  [code:count]                      200:600
Error Set:
Bucket           #    %
[0s,     100ms]  300  100.00%
[100ms,  200ms]  0    0.00%
Rate 60 rq/sec
Reverse Proxy with caching disabled
Requests      [total, rate, throughput]         410, 6.81, 5.82
Duration      [total, attack, wait]             1m10s, 1m0s, 10.301s
Latencies     [min, mean, 50, 90, 95, 99, max]  171.747ms, 9.492s, 10.303s, 10.338s, 10.366s, 12.338s, 15.508s
Bytes In      [total, mean]                     27622110, 67371.00
Bytes Out     [total, mean]                     0, 0.00
Success       [ratio]                           100.00%
Status Codes  [code:count]                      200:410
Error Set:
Bucket           #    %
[0s,     100ms]  0    0.00%
[100ms,  200ms]  1    0.24%
[200ms,  300ms]  0    0.00%
[300ms,  400ms]  1    0.24%
[400ms,  500ms]  1    0.24%
[500ms,  600ms]  0    0.00%
[600ms,  700ms]  1    0.24%
[700ms,  800ms]  1    0.24%
[800ms,  900ms]  0    0.00%
[900ms,  1s]     1    0.24%
[1s,     5s]     25   6.10%
[5s,     10s]    31   7.56%
[10s,    +Inf]   348  84.88%
Reverse Proxy with caching enabled
Requests      [total, rate, throughput]         3600, 60.02, 60.02
Duration      [total, attack, wait]             59.984s, 59.983s, 973.58µs
Latencies     [min, mean, 50, 90, 95, 99, max]  623.012µs, 994.68µs, 851.717µs, 1.17ms, 1.403ms, 1.684ms, 229.66ms
Bytes In      [total, mean]                     242535600, 67371.00
Bytes Out     [total, mean]                     0, 0.00
Success       [ratio]                           100.00%
Status Codes  [code:count]                      200:3600
Error Set:
Bucket           #     %
[0s,     100ms]  3599  99.89%
[100ms,  200ms]  1     0.11%
SPARQL Endpoint (Fuseki)
Requests      [total, rate, throughput]         3600, 60.02, 60.00
Duration      [total, attack, wait]             1m0s, 59.983s, 21.179ms
Latencies     [min, mean, 50, 90, 95, 99, max]  19.106ms, 20.935ms, 19.966ms, 22.752ms, 24.167ms, 33.937ms, 159.216ms
Bytes In      [total, mean]                     537008400, 149169.00
Bytes Out     [total, mean]                     1998000, 555.00
Success       [ratio]                           100.00%
Status Codes  [code:count]                      200:3600
Error Set:
Bucket           #     %
[0s,     100ms]  3596  99.89%
[100ms,  200ms]  4     0.11%